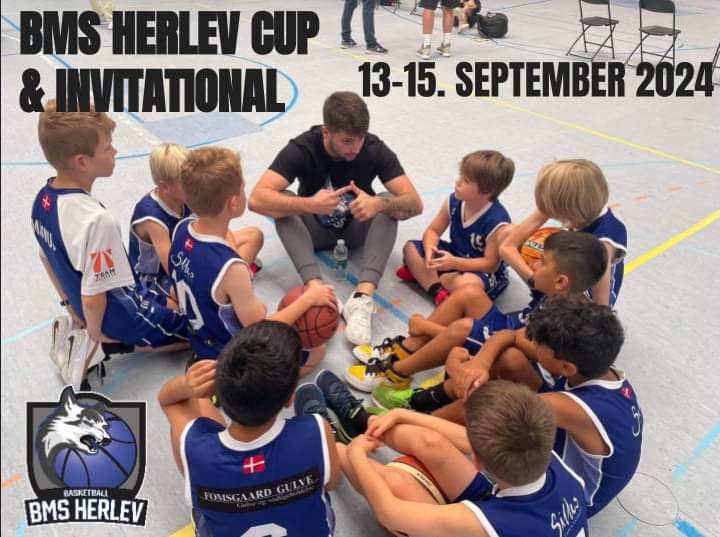
You are viewing the results for BMS Herlev Cup 2021. View the current results for BMS Herlev Cup 2024 here.
Statistics
Participating cities
Interesting facts
| Number of cities | 31 |
|---|---|
| Northermost city |  Norrköping Norrköping |
| Southernmost city |  Næstved Næstved |
| Most teams |  Frederiksberg c Frederiksberg c |
| Most scored goals |  Skovlunde Skovlunde |
| Most goals per team |  Skødstrup Skødstrup |
| Largest share of won matches |  Skødstrup Skødstrup |
| City | Teams | Games* | Played* | Won | Draw | Lost | Goals | ||||||||||||||||||||||||||||||||||||||||||||||||||||||||||||||||||||||||||||||||||||||||||||||
|---|---|---|---|---|---|---|---|---|---|---|---|---|---|---|---|---|---|---|---|---|---|---|---|---|---|---|---|---|---|---|---|---|---|---|---|---|---|---|---|---|---|---|---|---|---|---|---|---|---|---|---|---|---|---|---|---|---|---|---|---|---|---|---|---|---|---|---|---|---|---|---|---|---|---|---|---|---|---|---|---|---|---|---|---|---|---|---|---|---|---|---|---|---|---|---|---|---|---|---|---|---|
 Aarhus n Aarhus n |
1 | 3 | 3 | 1 (33 %) | 0 | 2 (66 %) | 156 - 160 | ||||||||||||||||||||||||||||||||||||||||||||||||||||||||||||||||||||||||||||||||||||||||||||||
 Allerød Allerød |
3 | 13 | 13 | 9 (69 %) | 0 | 4 (30 %) | 596 - 367 | ||||||||||||||||||||||||||||||||||||||||||||||||||||||||||||||||||||||||||||||||||||||||||||||
 Ballerup Ballerup |
2 | 8 | 8 | 3 (37 %) | 0 | 5 (62 %) | 162 - 285 | ||||||||||||||||||||||||||||||||||||||||||||||||||||||||||||||||||||||||||||||||||||||||||||||
 Charlottenlund Charlottenlund |
1 | 3 | 3 | 0 (0 %) | 0 | 3 (100 %) | 84 - 116 | ||||||||||||||||||||||||||||||||||||||||||||||||||||||||||||||||||||||||||||||||||||||||||||||
 Espergærde Espergærde |
1 | 3 | 3 | 0 (0 %) | 1 | 2 (66 %) | 0 - 40 | ||||||||||||||||||||||||||||||||||||||||||||||||||||||||||||||||||||||||||||||||||||||||||||||
 Frederiksberg Frederiksberg |
2 | 8 | 8 | 6 (75 %) | 0 | 2 (25 %) | 387 - 334 | ||||||||||||||||||||||||||||||||||||||||||||||||||||||||||||||||||||||||||||||||||||||||||||||
 Frederiksberg c Frederiksberg c |
24 | 95 | 95 | 32 (33 %) | 1 | 62 (65 %) | 2200 - 2875 | ||||||||||||||||||||||||||||||||||||||||||||||||||||||||||||||||||||||||||||||||||||||||||||||
 Gentofte Gentofte |
11 | 52 | 51 | 29 (56 %) | 0 | 22 (43 %) | 1886 - 1544 | ||||||||||||||||||||||||||||||||||||||||||||||||||||||||||||||||||||||||||||||||||||||||||||||
 Glostrup Glostrup |
2 | 9 | 9 | 4 (44 %) | 0 | 5 (55 %) | 108 - 226 | ||||||||||||||||||||||||||||||||||||||||||||||||||||||||||||||||||||||||||||||||||||||||||||||
 Hillerød Hillerød |
2 | 11 | 11 | 7 (63 %) | 0 | 4 (36 %) | 370 - 252 | ||||||||||||||||||||||||||||||||||||||||||||||||||||||||||||||||||||||||||||||||||||||||||||||
 Holbæk Holbæk |
1 | 4 | 4 | 2 (50 %) | 0 | 2 (50 %) | 168 - 198 | ||||||||||||||||||||||||||||||||||||||||||||||||||||||||||||||||||||||||||||||||||||||||||||||
 Horsens Horsens |
2 | 8 | 8 | 3 (37 %) | 0 | 5 (62 %) | 293 - 411 | ||||||||||||||||||||||||||||||||||||||||||||||||||||||||||||||||||||||||||||||||||||||||||||||
 Hvidovre Hvidovre |
3 | 11 | 11 | 5 (45 %) | 0 | 6 (54 %) | 328 - 410 | ||||||||||||||||||||||||||||||||||||||||||||||||||||||||||||||||||||||||||||||||||||||||||||||
 Hørsholm Hørsholm |
3 | 12 | 12 | 6 (50 %) | 0 | 6 (50 %) | 343 - 379 | ||||||||||||||||||||||||||||||||||||||||||||||||||||||||||||||||||||||||||||||||||||||||||||||
 Kastrup Kastrup |
11 | 46 | 46 | 26 (56 %) | 0 | 20 (43 %) | 1457 - 1137 | ||||||||||||||||||||||||||||||||||||||||||||||||||||||||||||||||||||||||||||||||||||||||||||||
 Kbh n Kbh n |
3 | 14 | 14 | 7 (50 %) | 0 | 7 (50 %) | 469 - 415 | ||||||||||||||||||||||||||||||||||||||||||||||||||||||||||||||||||||||||||||||||||||||||||||||
 Kongens lyngby Kongens lyngby |
1 | 6 | 6 | 5 (83 %) | 0 | 1 (16 %) | 223 - 137 | ||||||||||||||||||||||||||||||||||||||||||||||||||||||||||||||||||||||||||||||||||||||||||||||
 København n København n |
3 | 12 | 11 | 6 (54 %) | 0 | 5 (45 %) | 312 - 274 | ||||||||||||||||||||||||||||||||||||||||||||||||||||||||||||||||||||||||||||||||||||||||||||||
 Malmö Malmö |
4 | 20 | 20 | 12 (60 %) | 0 | 8 (40 %) | 585 - 714 | ||||||||||||||||||||||||||||||||||||||||||||||||||||||||||||||||||||||||||||||||||||||||||||||
 Norrköping Norrköping |
1 | 4 | 4 | 2 (50 %) | 0 | 2 (50 %) | 136 - 106 | ||||||||||||||||||||||||||||||||||||||||||||||||||||||||||||||||||||||||||||||||||||||||||||||
 Næstved Næstved |
1 | 3 | 3 | 1 (33 %) | 0 | 2 (66 %) | 182 - 190 | ||||||||||||||||||||||||||||||||||||||||||||||||||||||||||||||||||||||||||||||||||||||||||||||
 Risskov Risskov |
1 | 5 | 5 | 4 (80 %) | 0 | 1 (20 %) | 212 - 174 | ||||||||||||||||||||||||||||||||||||||||||||||||||||||||||||||||||||||||||||||||||||||||||||||
 Rungsted Rungsted |
2 | 8 | 8 | 2 (25 %) | 0 | 6 (75 %) | 75 - 183 | ||||||||||||||||||||||||||||||||||||||||||||||||||||||||||||||||||||||||||||||||||||||||||||||
 Rungsted kyst Rungsted kyst |
8 | 34 | 34 | 12 (35 %) | 0 | 22 (64 %) | 939 - 1240 | ||||||||||||||||||||||||||||||||||||||||||||||||||||||||||||||||||||||||||||||||||||||||||||||
 Skovlunde Skovlunde |
14 | 62 | 61 | 40 (65 %) | 0 | 21 (34 %) | 2309 - 1758 | ||||||||||||||||||||||||||||||||||||||||||||||||||||||||||||||||||||||||||||||||||||||||||||||
 Skødstrup Skødstrup |
1 | 7 | 7 | 6 (85 %) | 0 | 1 (14 %) | 325 - 171 | ||||||||||||||||||||||||||||||||||||||||||||||||||||||||||||||||||||||||||||||||||||||||||||||
 Søborg Søborg |
9 | 38 | 38 | 19 (50 %) | 0 | 19 (50 %) | 1381 - 1483 | ||||||||||||||||||||||||||||||||||||||||||||||||||||||||||||||||||||||||||||||||||||||||||||||
 Valby Valby |
2 | 6 | 6 | 2 (33 %) | 0 | 4 (66 %) | 278 - 308 | ||||||||||||||||||||||||||||||||||||||||||||||||||||||||||||||||||||||||||||||||||||||||||||||
 Virum Virum |
2 | 9 | 9 | 5 (55 %) | 0 | 4 (44 %) | 289 - 315 | ||||||||||||||||||||||||||||||||||||||||||||||||||||||||||||||||||||||||||||||||||||||||||||||
 Værløse Værløse |
2 | 8 | 8 | 3 (37 %) | 0 | 5 (62 %) | 186 - 234 | ||||||||||||||||||||||||||||||||||||||||||||||||||||||||||||||||||||||||||||||||||||||||||||||
 Åbyhøj Åbyhøj |
4 | 16 | 15 | 7 (46 %) | 0 | 8 (53 %) | 410 - 385 | ||||||||||||||||||||||||||||||||||||||||||||||||||||||||||||||||||||||||||||||||||||||||||||||
| * Note that since each match has two teams, the number of matches in the table will appear to be two times the actual number of matches. | |||||||||||||||||||||||||||||||||||||||||||||||||||||||||||||||||||||||||||||||||||||||||||||||||||||


